
How WildEdge works
Your app or LLM gateway sends events to a project. You investigate them as events and runs, query them with SQL, chart them on dashboards, and turn the useful ones into datasets you can export for training.
inferencemodel_loaderrorfeedbackspanCompanies and projects
A company is your organization in WildEdge. It holds your team and billing.
A project holds the telemetry for one application or environment, for example ios-app or support-bot-staging. Events, runs, datasets, charts, dashboards, and training integrations all belong to a project. Most teams use one project per application and environment.
Keys and tokens
Three kinds of credential do three different jobs. None of them can do another's job.
| Credential | What it does | Where you get it |
|---|---|---|
| DSN (project key) | Sends telemetry into one project. Cannot read data. | Project API Keys, then Reveal DSN |
| MCP token or OAuth sign-in | Lets your AI agent read data, and with write access create projects, charts, and dashboards | Your profile, or the agent's sign-in flow. See Connect your AI agent. |
| Training provider API key | Lets WildEdge upload datasets to an external training service | The provider, for example Edge Impulse |
A DSN looks like https://<secret>@ingest.wildedge.dev/<key>. Treat it as a secret. Create a separate project key for each integration you may need to revoke on its own.
Events
An event is one thing that happened, recorded with its time, model, device, and measurements.
| Event | Records |
|---|---|
inference | One model call: timing, tokens, input and output measurements, predictions |
model_load, model_download, model_unload | A model's lifecycle on the device |
error | A failure, with its code and message |
feedback | A user's reaction to an inference, such as thumbs up or an edit |
span | A timed step in your application, such as a retrieval or a tool call |
Events come from two sources. The SDK runs in your app and records local and cloud model calls, with device and hardware context. A gateway such as LiteLLM, OpenRouter, or Bifrost exports the cloud calls that pass through it, with no change to your app. See Choose your setup.
The telemetry reference lists every field.
Runs, traces, and spans
A run is one execution of a workflow or agent, for example one car scan or one support conversation turn. Its events and spans share a run_id.
A span is a timed step inside a run, such as an agent step, a tool call, or a retrieval. Spans nest, and with the run's model calls they form the trace you see on the run's page:
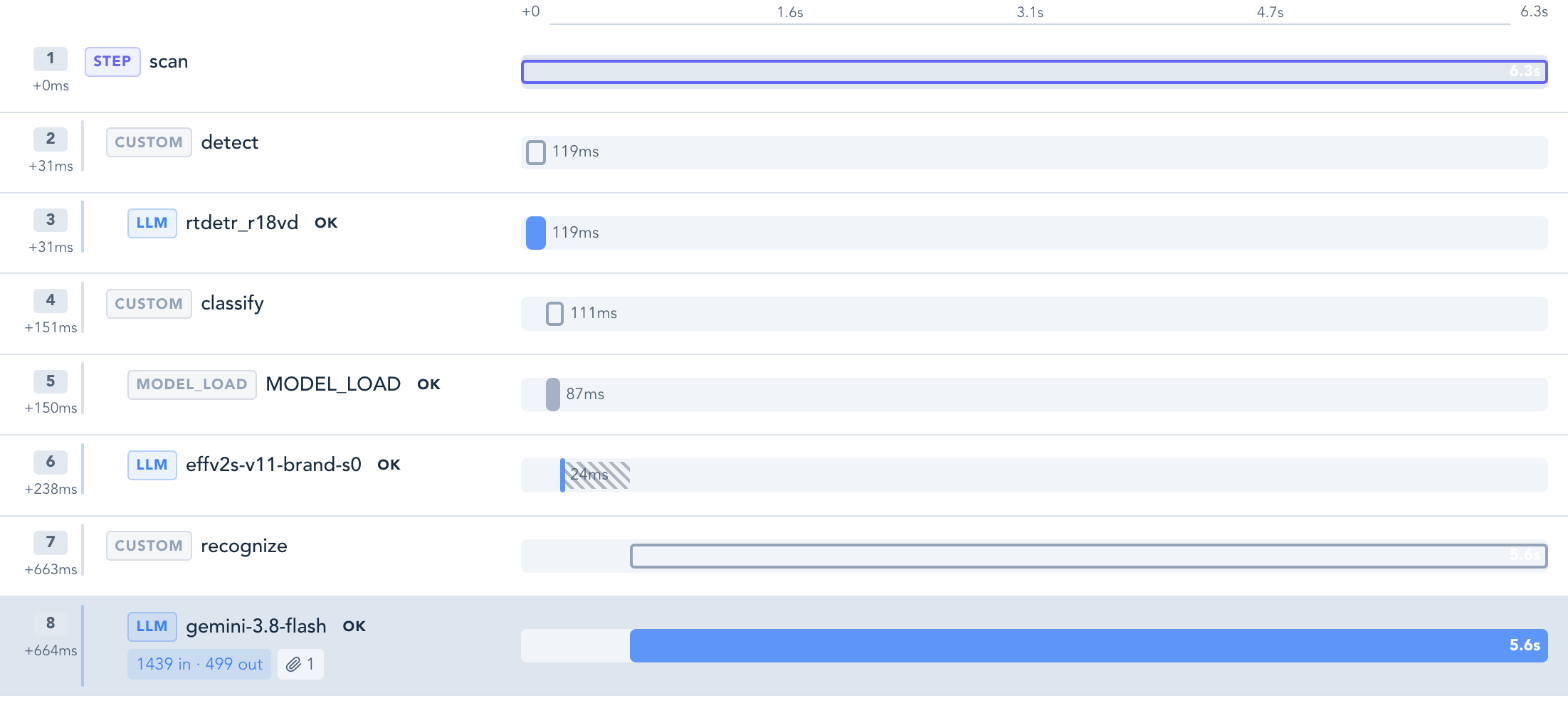
If you know OpenTelemetry: a run is a trace, a span is a span, and an inference event is a leaf span that carries model data.
Runs and spans come from wildedge.trace() and wildedge.span() in the SDK, or the Swift and Kotlin equivalents.
Attachments
By default WildEdge records measurements, not content. An attachment is an input or output file, such as an image, an audio clip, or text, that you choose to upload with an inference event. Each attachment has a role: input or output.
Attachment capture is off until you enable it in Project Settings and in your SDK. Upload size, count, and retention depend on your plan. See Captured content.
SQL and charts
Every project has one queryable table, events. Open SQL to run read-only SQL against it, limited to the project and the selected time window.
SELECT model_name, quantile_cont(duration_ms, 0.95) AS p95_ms, count(*) AS calls
FROM events
WHERE event_type = 'inference'
GROUP BY model_name
ORDER BY p95_ms DESC- Write SQL or build without it. Analytics has a builder with filters and axes. SQL takes raw queries.
- Ask in plain language. Describe what you want, for example "average latency by device model last 7 days", and WildEdge generates the SQL. This uses an AI provider key you add in Settings.
- Save as a chart. A saved query becomes a chart: a table, a stat, a line, or a bar. You can download results as CSV.
Your agent can do the same through MCP: sql_schema lists columns and sql_query runs a query.
Dashboards
A dashboard is a page of panels. Each panel shows one saved chart, and the whole dashboard follows one time window. The same chart can appear on several dashboards. Editing the chart updates it everywhere.
Build dashboards in Dashboards, or ask your agent: create_chart saves a SQL chart and add_dashboard_panel places it.
Datasets
A dataset is a curated set of events with their attachments, for evaluation or fine-tuning. You can fill one in two ways:
- Build from filters. Select events by time range, model, version, device, prediction label, confidence range, or error code, preview the result, then build.
- Add events by hand from the Events list, one or many at a time, or from an event's page.
Each row carries the event's predicted label. You can override the label for a row inside a dataset without changing the original event. A dataset shows how many rows have an input and an output attachment.
Datasets need attachment capture. Without it, there is nothing to train on. See Build evaluation datasets.
Training export
A training integration connects a project to an external training service. Edge Impulse is supported today.
- In Training, add an integration with your Edge Impulse API key. WildEdge verifies it.
- Start an export job for a dataset. WildEdge uploads the dataset's image attachments with their labels to your Edge Impulse project. You can force one label for every image.
- Follow the job's progress and result in Training.
Training integrations may need to be enabled for your project. Contact us if Training is not available.
Glossary
| Term | Meaning | Similar to |
|---|---|---|
| Company | Your organization, team, and billing | Organization, workspace |
| Project | Telemetry for one app or environment | Project |
| DSN | Write-only key that sends events to a project | Sentry DSN, ingestion key |
| Event | One recorded occurrence: inference, load, error, feedback, span | Log record, span |
| Run | One workflow or agent execution, grouped by run_id | Trace, session |
| Span | A timed step inside a run | Span |
| Attachment | An opt-in input or output file on an inference | Payload, blob |
| Chart | A saved query with a visualization | Saved query, insight |
| Dashboard | A page of chart panels over one time window | Dashboard, board |
| Dataset | Curated events with attachments and labels | Dataset |
| Export job | One upload of a dataset to a training service | Sync |
Next
- Send your first event: on-device quickstart or cloud API quickstart.
- Investigate events and traces.
- Connect your AI agent to query, chart, and build dashboards for you.